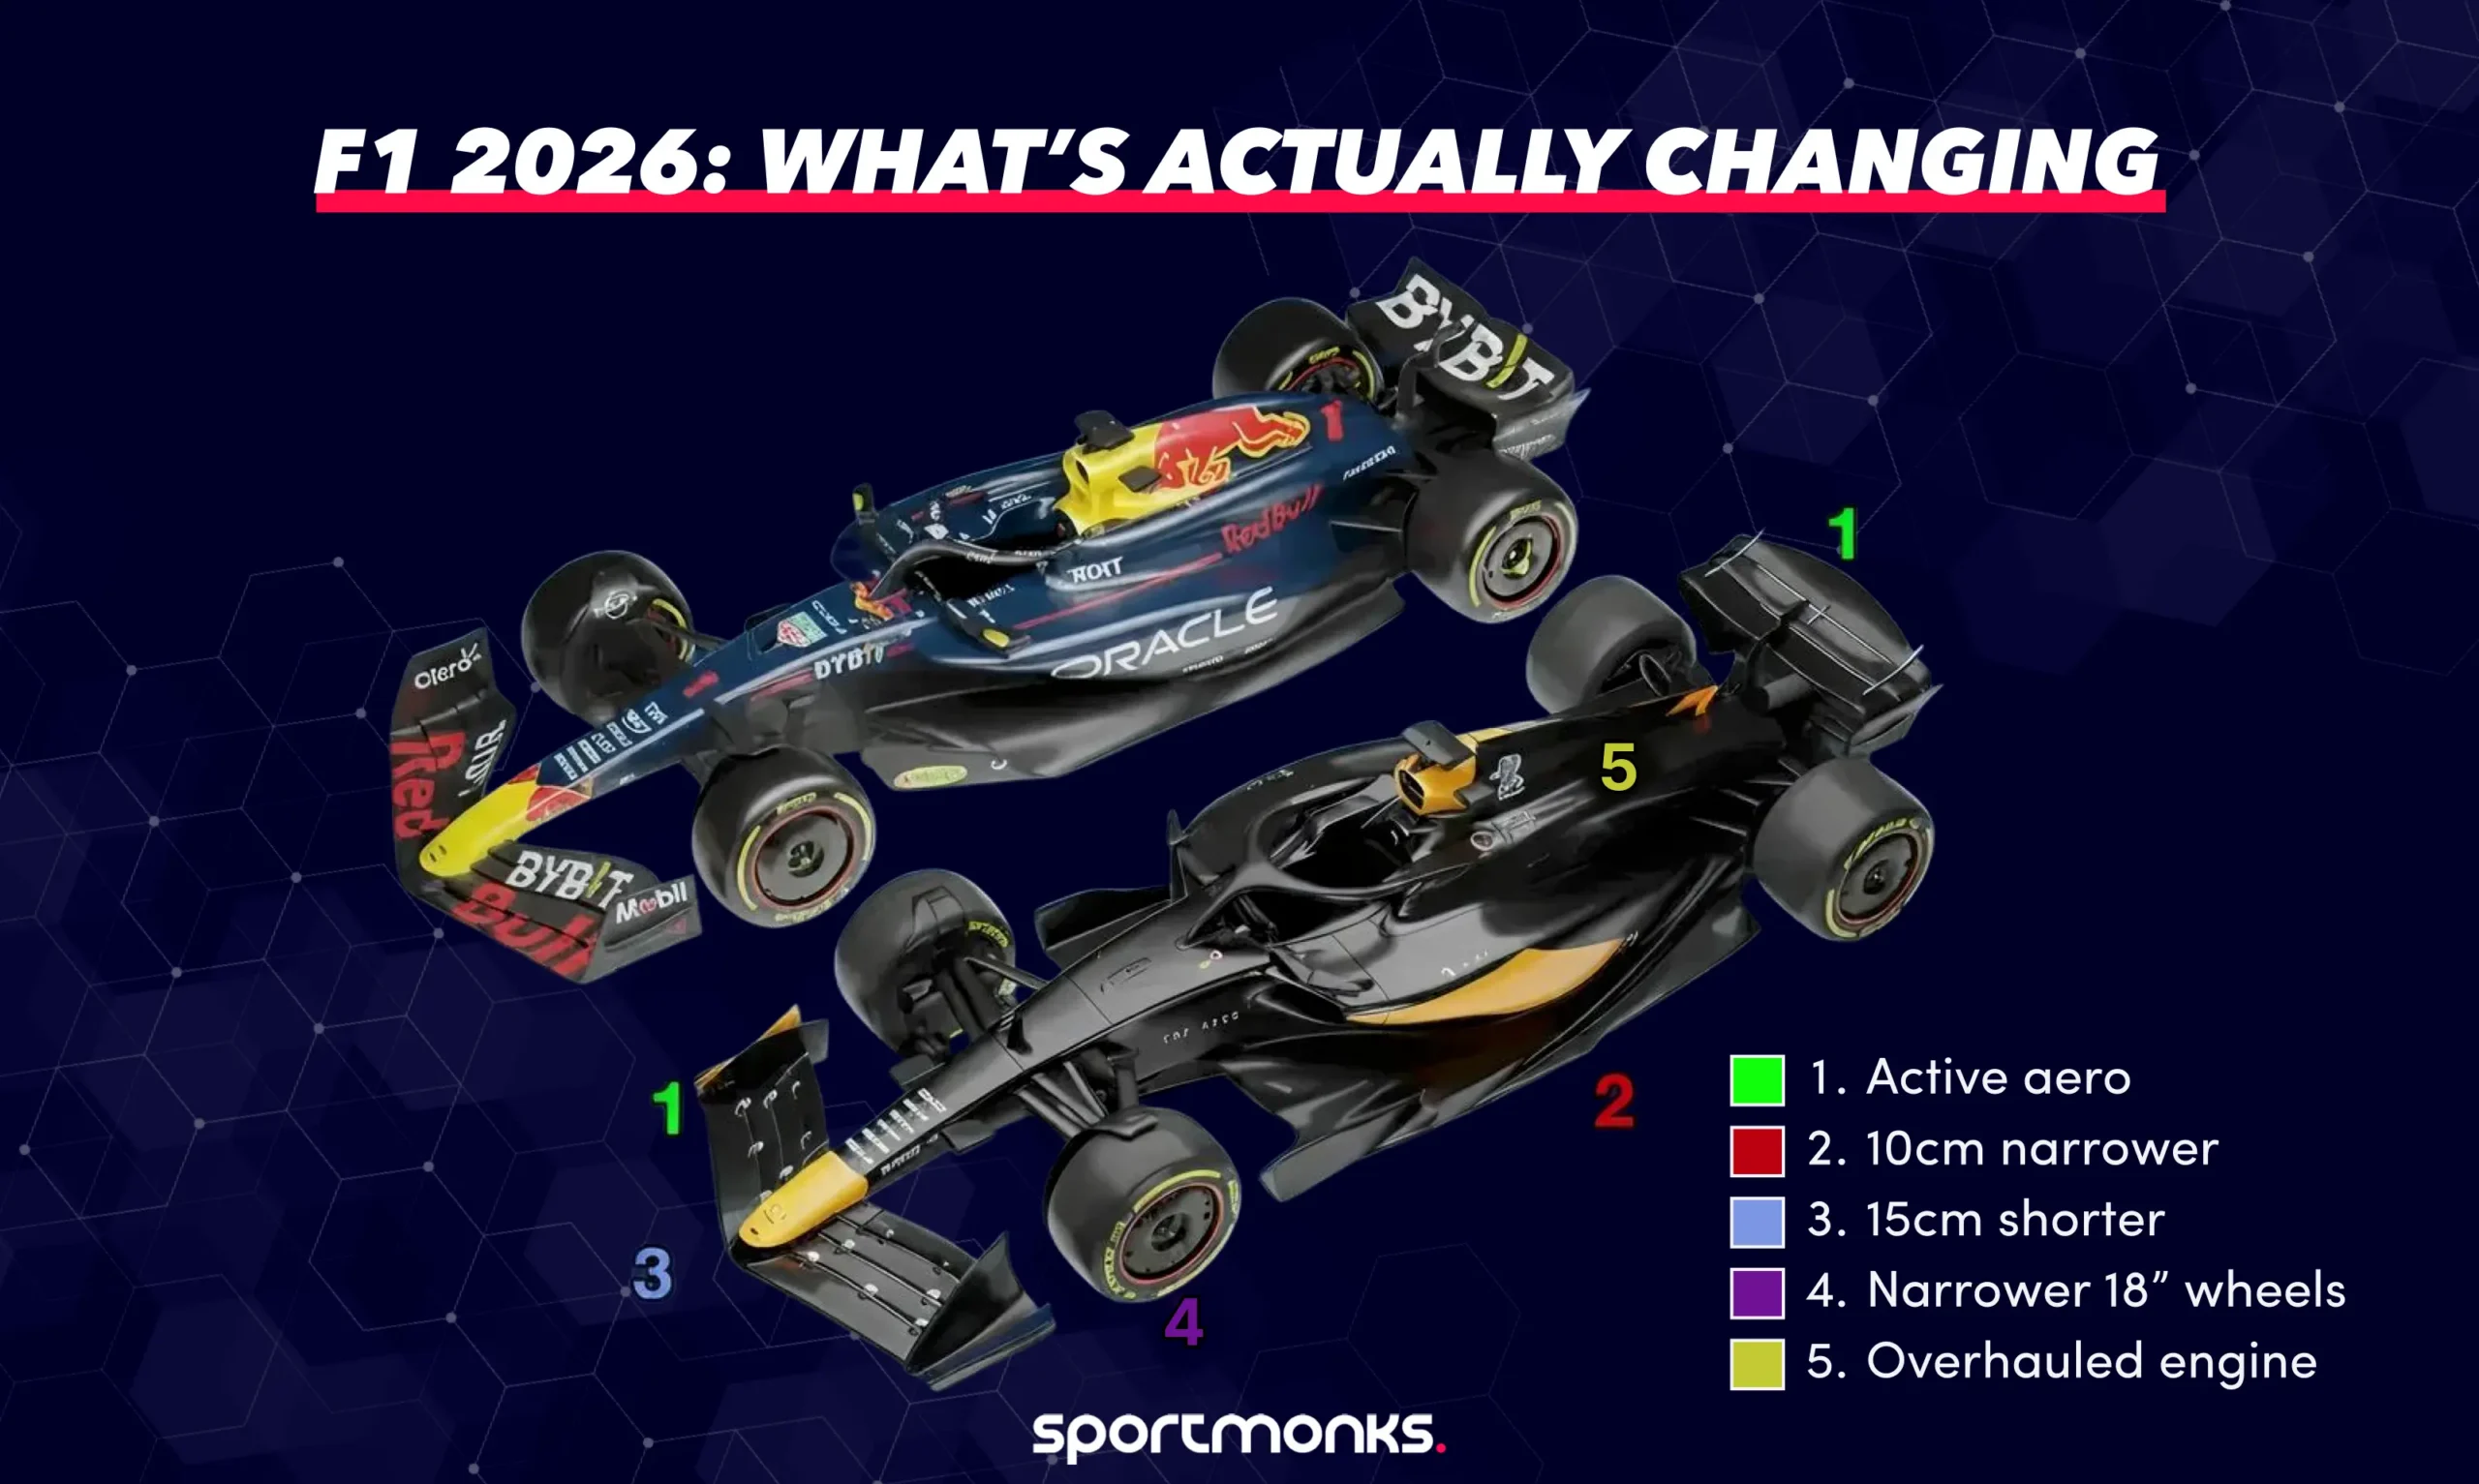
Contents
Race distance and structure
Albert Park remains one of the faster circuits on the calendar.
– Circuit length: 5.278 km
– Total race distance: 306.124 km
– Total laps: 58
– Race duration: 1:23:06.801
That structure matters.
A 58-lap race creates enough variation for multiple strategies, but not enough margin for repeated recovery drives. Every pit stop decision carries weight.
The margin at the front
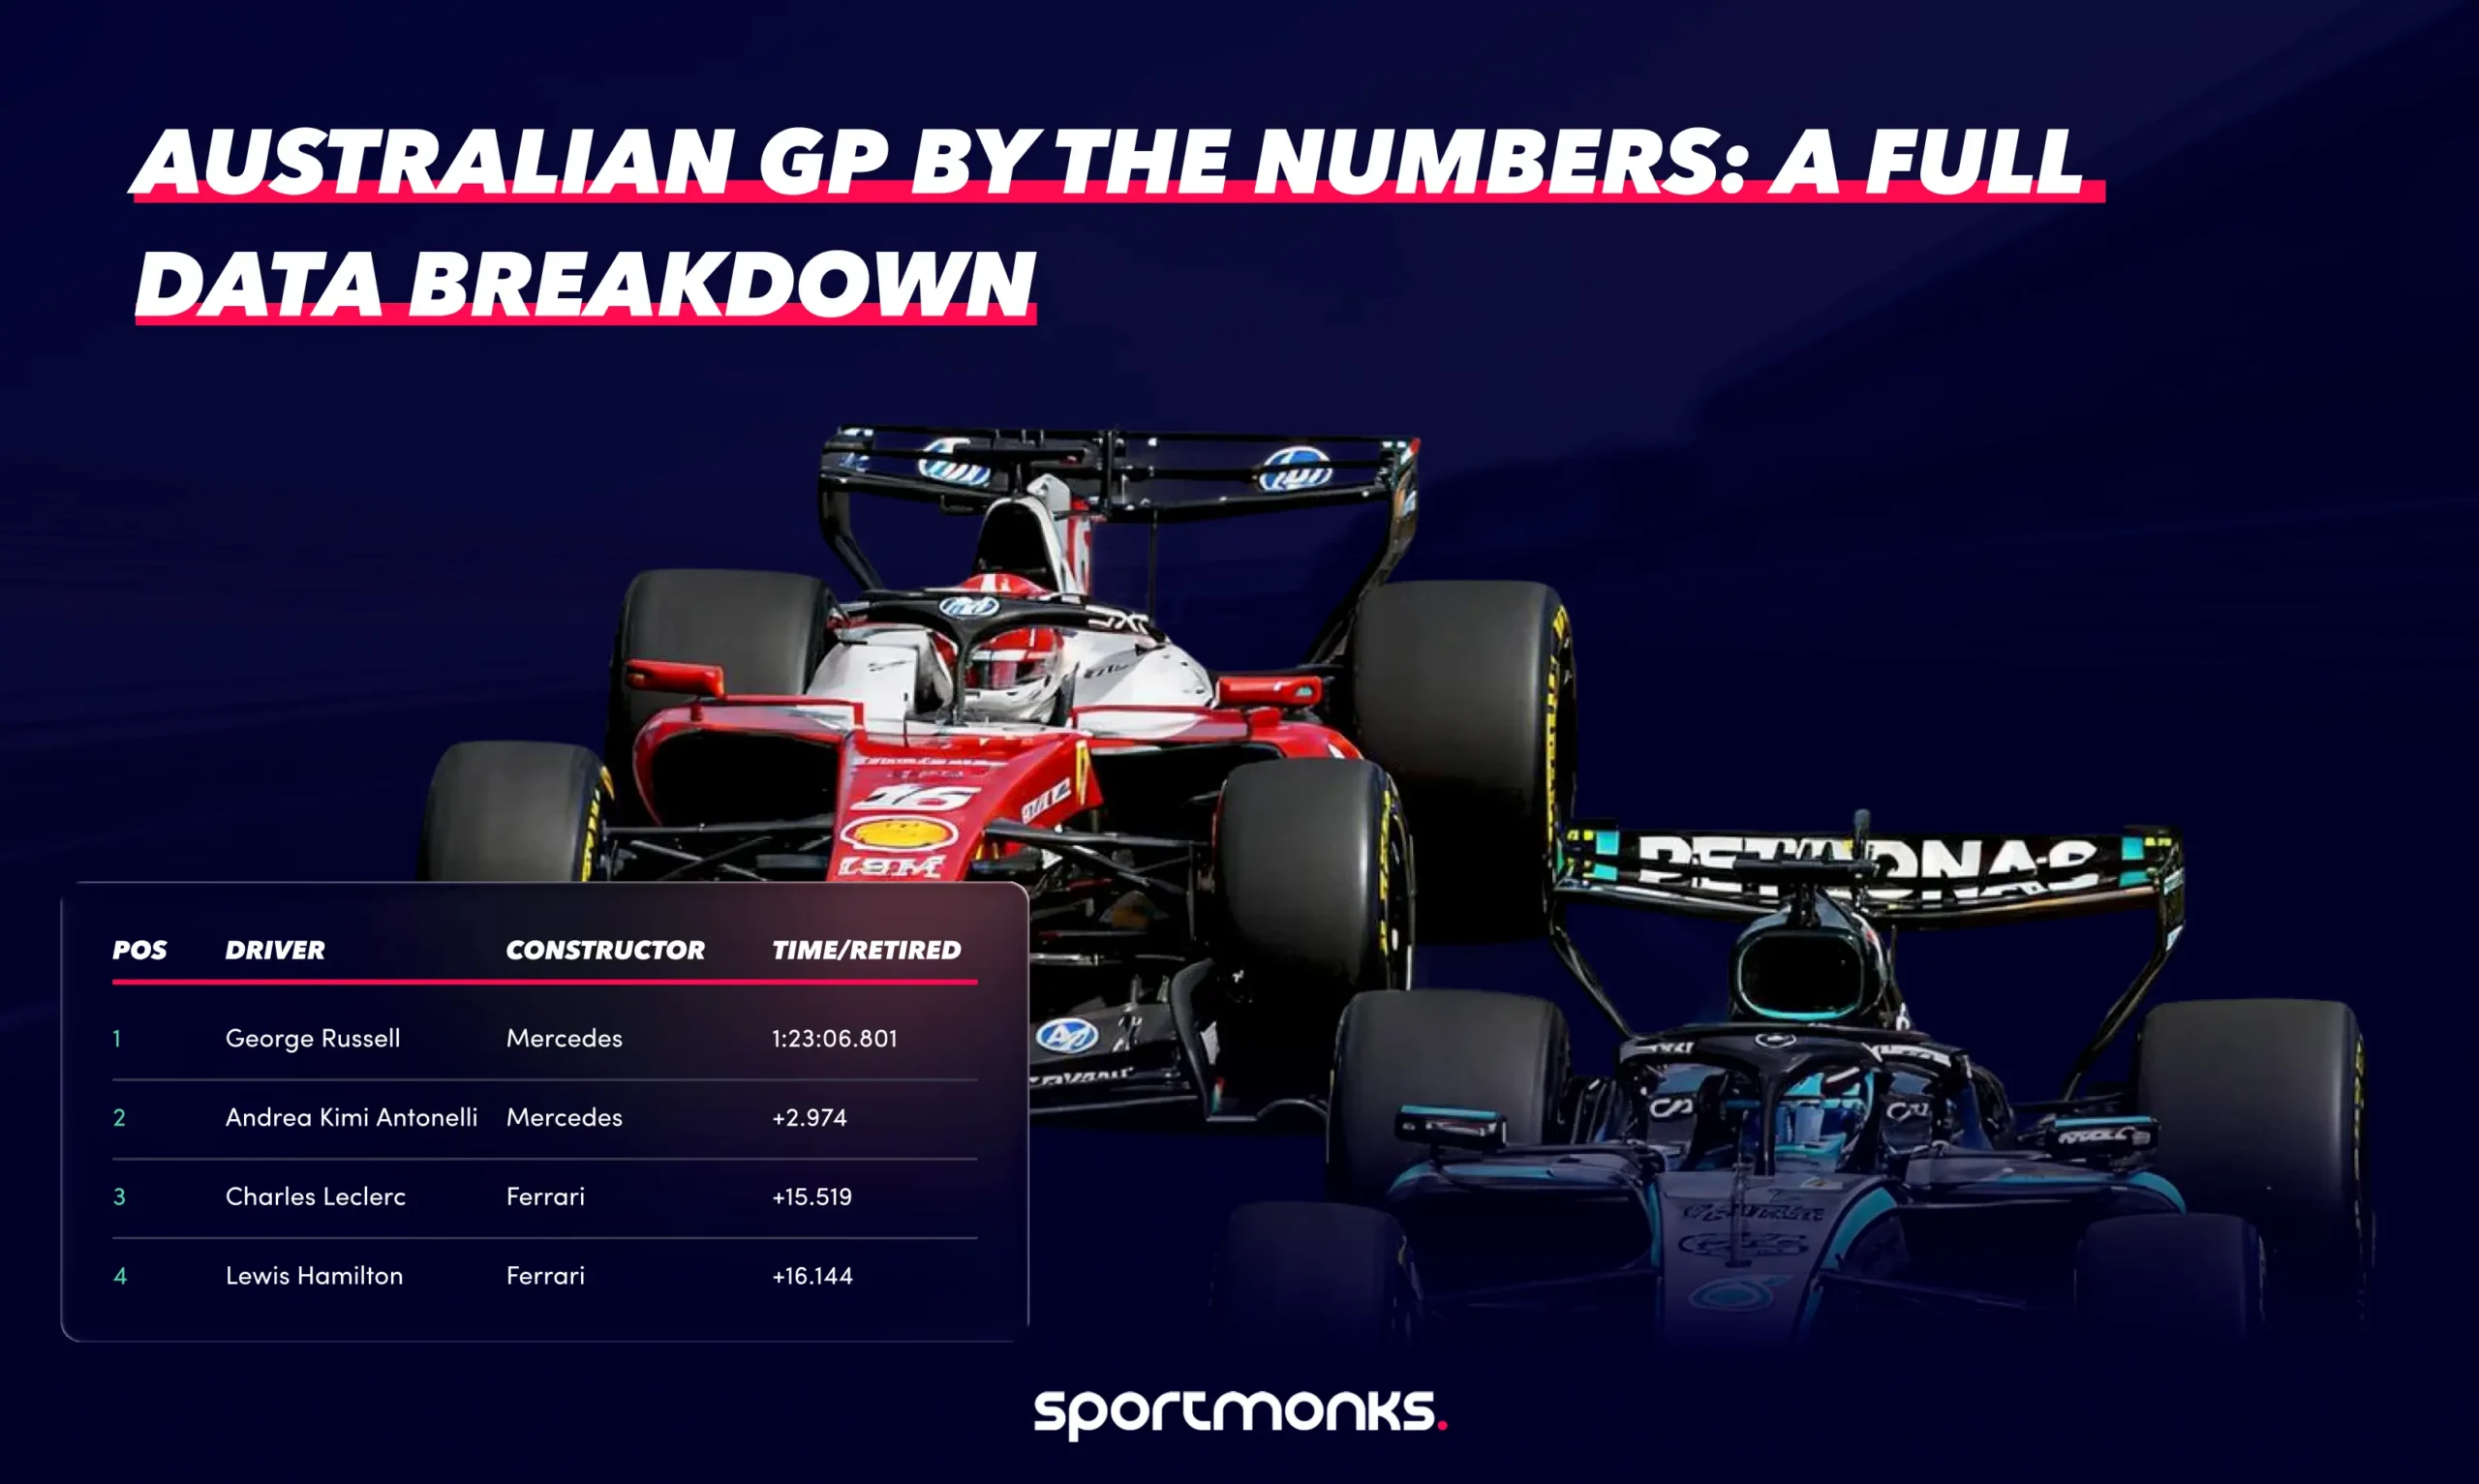
The final result suggests control.
The numbers suggest something tighter.
– Russell → Antonelli: +2.974s
– Antonelli → Leclerc: +15.5s
– Leclerc → Hamilton: +0.6s
Two different races were happening.
At the front, Mercedes controlled the pace. Behind them, Ferrari ran close enough to fight but not close enough to attack.
That gap, around three seconds over a full race distance, is the difference between control and pressure.
Fastest lap versus race pace
Max Verstappen set the fastest lap of the race.
– Fastest lap: 1:22.091 (Lap 43)
But he finished sixth.
That contrast matters.
The fastest lap shows peak performance. Race pace shows consistency. A dashboard that only highlights fastest laps misses the bigger picture.
Russell did not need the fastest lap. He needed consistent laps.
Strategy split: one stop versus two
The defining number of the race was not the lap time.
It was pit stops.
Mercedes is committed to a one-stop strategy under Virtual Safety Car conditions. Ferrari did not.
That single decision created:
– track position advantage
– reduced time loss in the pit lane
– cleaner air in the final stint
In raw terms, a pit stop costs around 20–25 seconds at Albert Park.
Avoiding one stop is effectively gaining that time back.
Virtual safety cars and race impact
The race featured multiple Virtual Safety Car periods.
These matters are more than they appear.
Under VSC conditions:
– pit stop time loss is reduced
– gaps between cars compress
– Strategy windows shift instantly.
Mercedes used these moments to pit both cars and commit to the winning strategy.
Without the VSC timing, the race outcome is likely to change.
Position changes and recovery drives
One of the standout numbers from the race:
– Verstappen: P20 → P6
That is a 14-place recovery.
But it came at a cost.
Running through traffic impacts lap time, tyre life, and strategy flexibility. Recovery drives look impressive in isolation, but the numbers usually show lost time early in the race that cannot be fully recovered.
Reliability and attrition
The race also highlighted early-season reliability gaps.
– Multiple DNFs and DNS
– Piastri is out before the start.
– several mid-race retirements
At the start of a regulation cycle, finishing the race is a competitive advantage.
Points are not only about pace. They are about survival.
The midfield spread
Beyond the top four, the field opened up quickly.
– Top four within ~20 seconds
– Fifth place, over 50 seconds behind
That gap shows the early hierarchy.
Mercedes and Ferrari are operating at one level. The rest of the field is still catching up.
What the data actually shows
When you combine all the numbers, the race becomes clearer.
– Mercedes won through strategy, not outright dominance.
– Ferrari lost track position at the critical moment.
– The fastest lap did not translate into a race result.
– VSC timing decided the strategy window
– Consistency beats peak performance.
The result was not random.
It was structured.
Using the Sportmonks API to break this race down
Everything in this race can be reconstructed through data.
This is exactly where the Sportmonks Motorsport API fits.
The API provides structured race data, including fixtures, live race states, lap timing, pit stops, and standings through a REST interface with JSON responses.
Using the Australian Grand Prix as an example, you would map the race like this:
– fixtures → identify the race and session
– livescores → track when the race goes live
– laps → analyse lap-by-lap performance
– pitstops → track strategy decisions
– results → build the race classification
Lap endpoints let you compare drivers lap by lap, revealing where time is gained or lost.
Pit stop endpoints show exactly when strategy decisions were made and how they impacted position.
Live endpoints allow you to follow the race as it unfolds, not just after it finishes.
Put together, these endpoints recreate the race in full.
Not just the final result, but the process behind it.
What Melbourne tells us about the season
Albert Park is not a perfect reference circuit.
But it tells you:
– Which teams understand their cars
– Which strategies work under pressure
– Which drivers can manage pace across a full race
The 2026 Australian Grand Prix showed that early.
Mercedes executed. Ferrari hesitated. The rest of the field reacted.
That pattern may change.
But the data from Melbourne is the first real signal.