Contents
What a real-time F1 dashboard actually shows
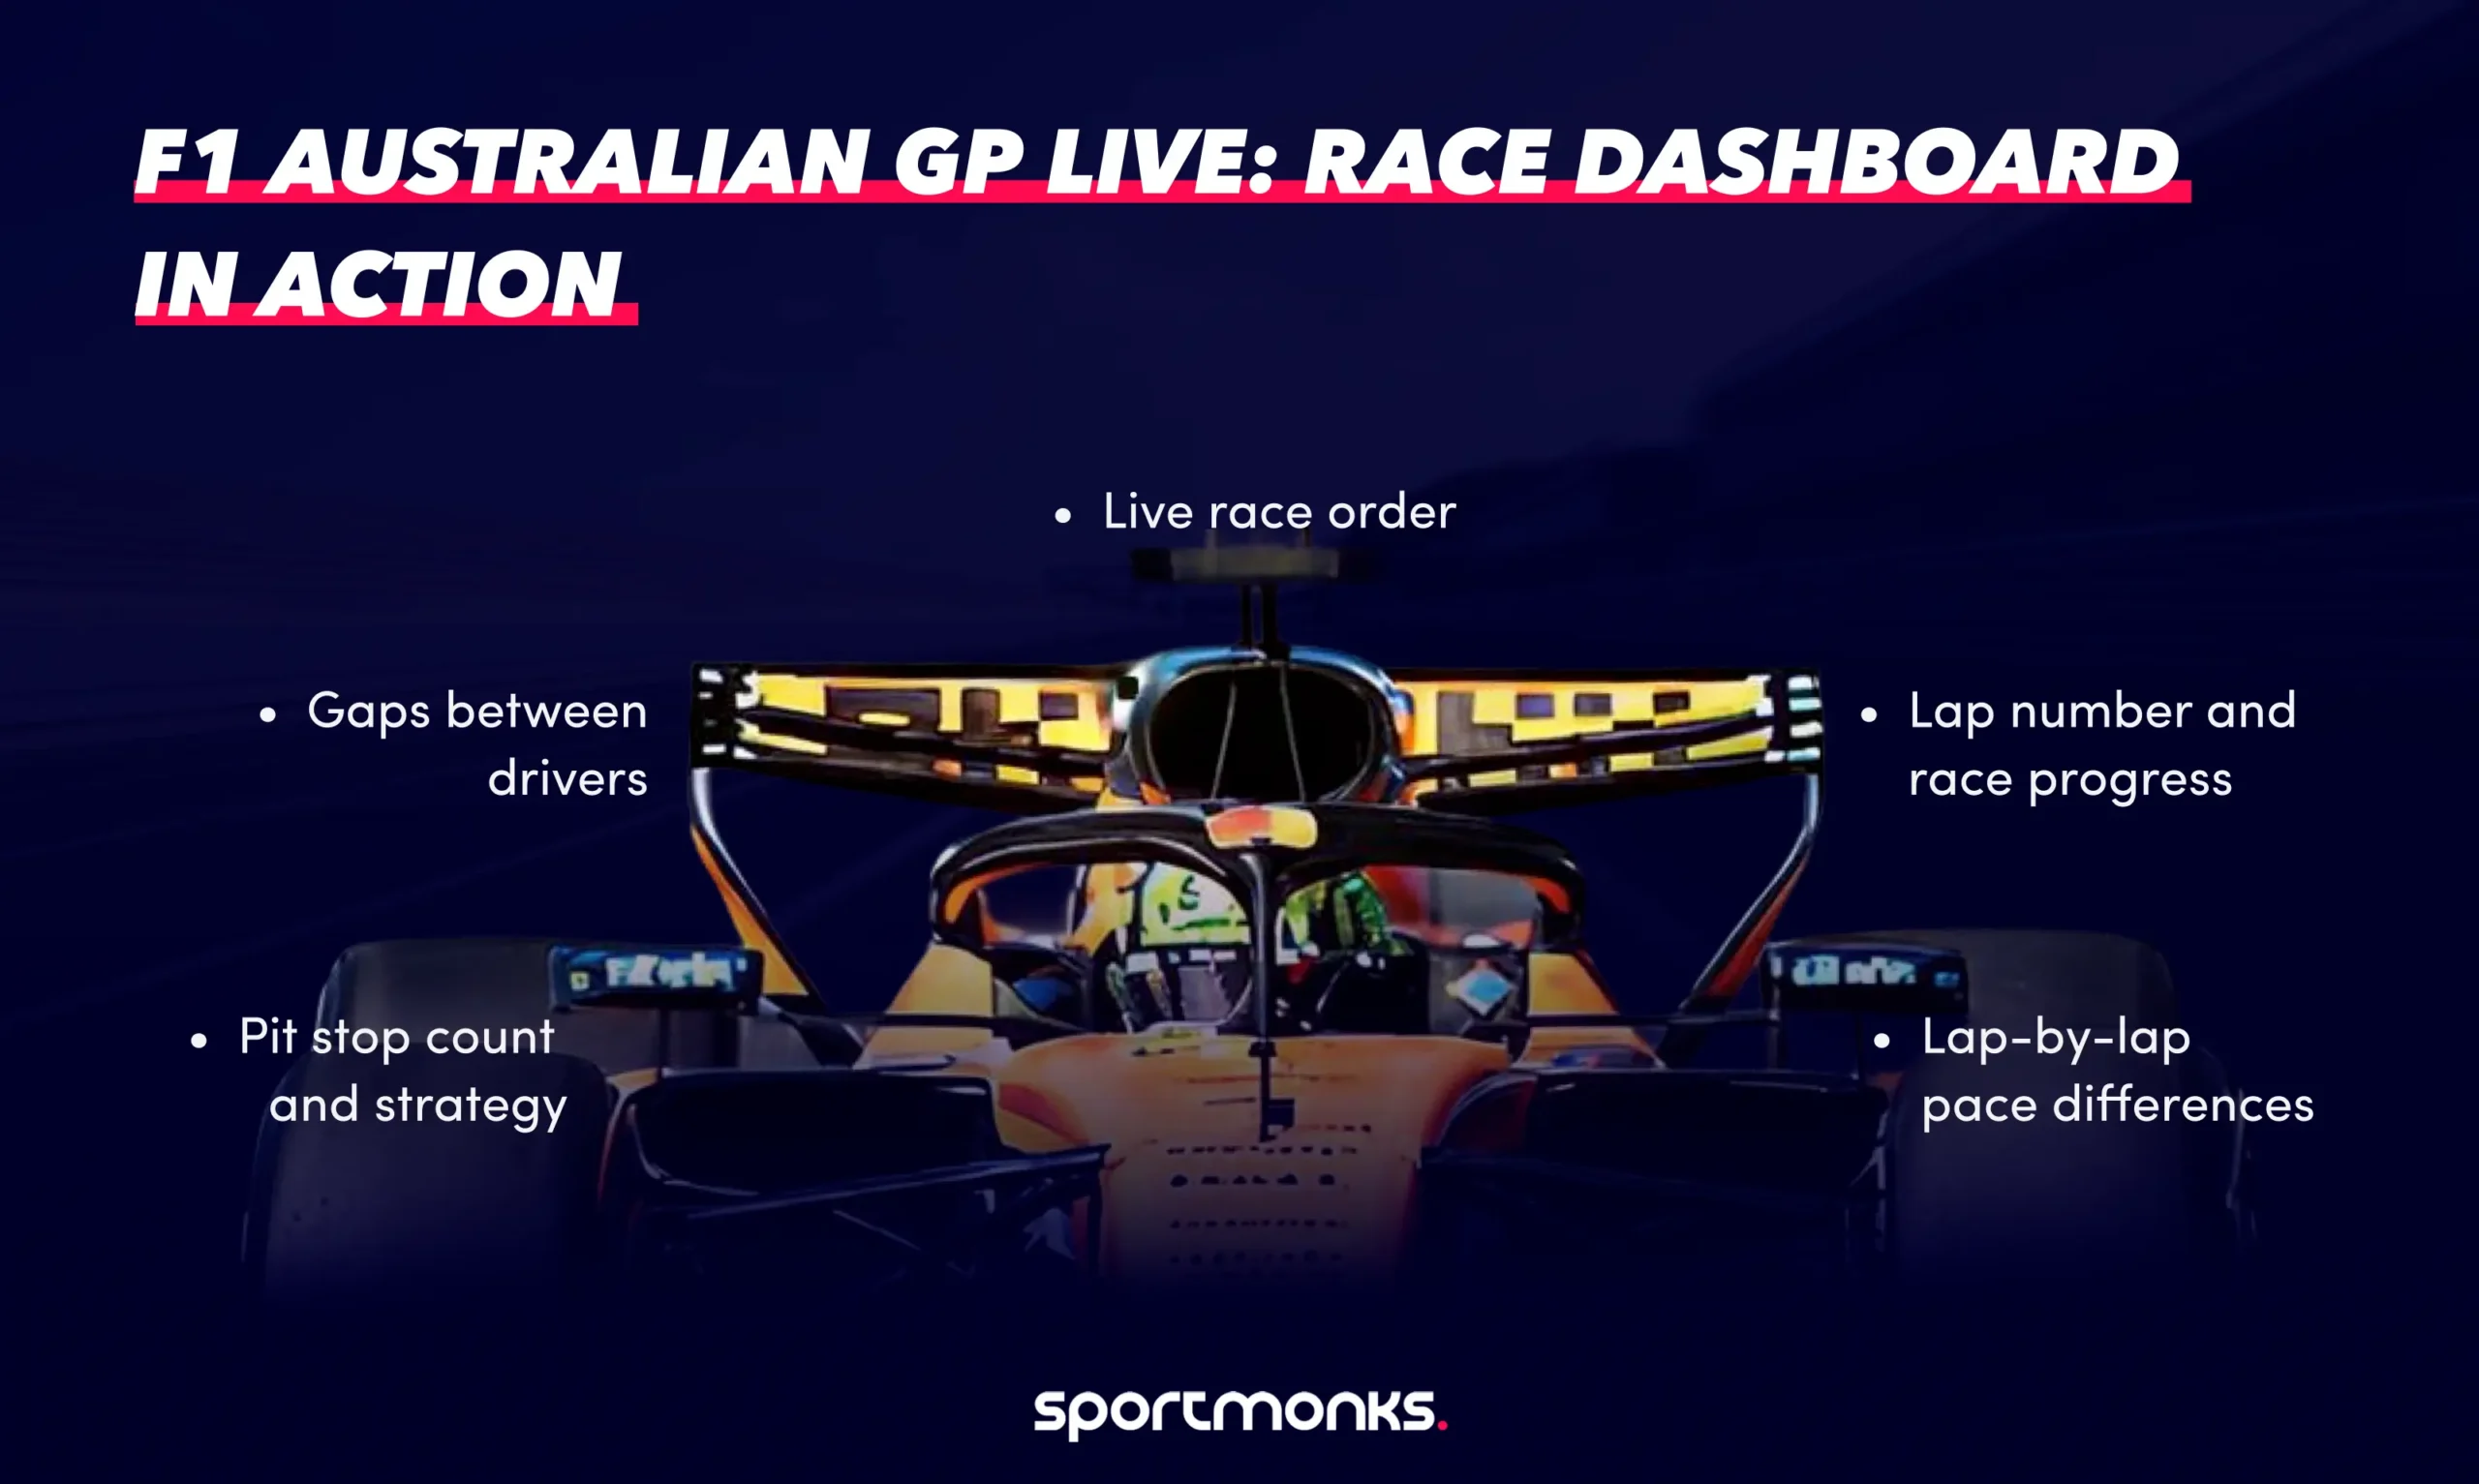
A race dashboard usually tells three simultaneous stories:
- The current race order
- The pace of each driver
- The strategy decisions shaping the race
At the simplest level, a dashboard shows the leaderboard: positions, lap counts, and time gaps.
But once you start layering race data, the story becomes far more interesting.
Lap-by-lap timing reveals which drivers are pushing and which are managing tyres. Sector splits highlight where cars gain time on specific parts of the circuit. Pit stops explain sudden position changes in the race order.
These are exactly the kinds of data layers documented in the Motorsport API v3, which provides endpoints for fixtures, live sessions, laps, pit stops, teams, drivers, and standings.
The key data layers behind a race dashboard
Before writing any code, it helps to think about the dashboard as a set of independent data layers.
Race metadata
Every dashboard begins with race metadata.
You need to know:
– which race is running
– which circuit is hosting the event
– which session is active
– whether the race is live or finished
This information comes from the fixtures endpoints, which return race events across the season calendar along with venue, stage, and season information.
Fixtures represent races, qualifying sessions, or practice sessions and are one of the most frequently used resources in the Motorsport API because they provide the base identifier used by most other endpoints.
Typical use cases include:
– building season calendars
– showing upcoming races
– retrieving the fixture ID used in later API calls
Detecting live sessions
Once you know the race fixture, the next step is determining whether the session is currently active.
The live endpoints allow developers to retrieve fixtures that are currently live, starting soon, or recently finished.
This makes them ideal for:
– live race trackers
– real-time dashboards
– race state monitoring
– automated alerts for session changes
The livescores endpoint returns the races currently running in the API and allows developers to include additional related entities such as participants, venue information, and lap data.
Driver leaderboard
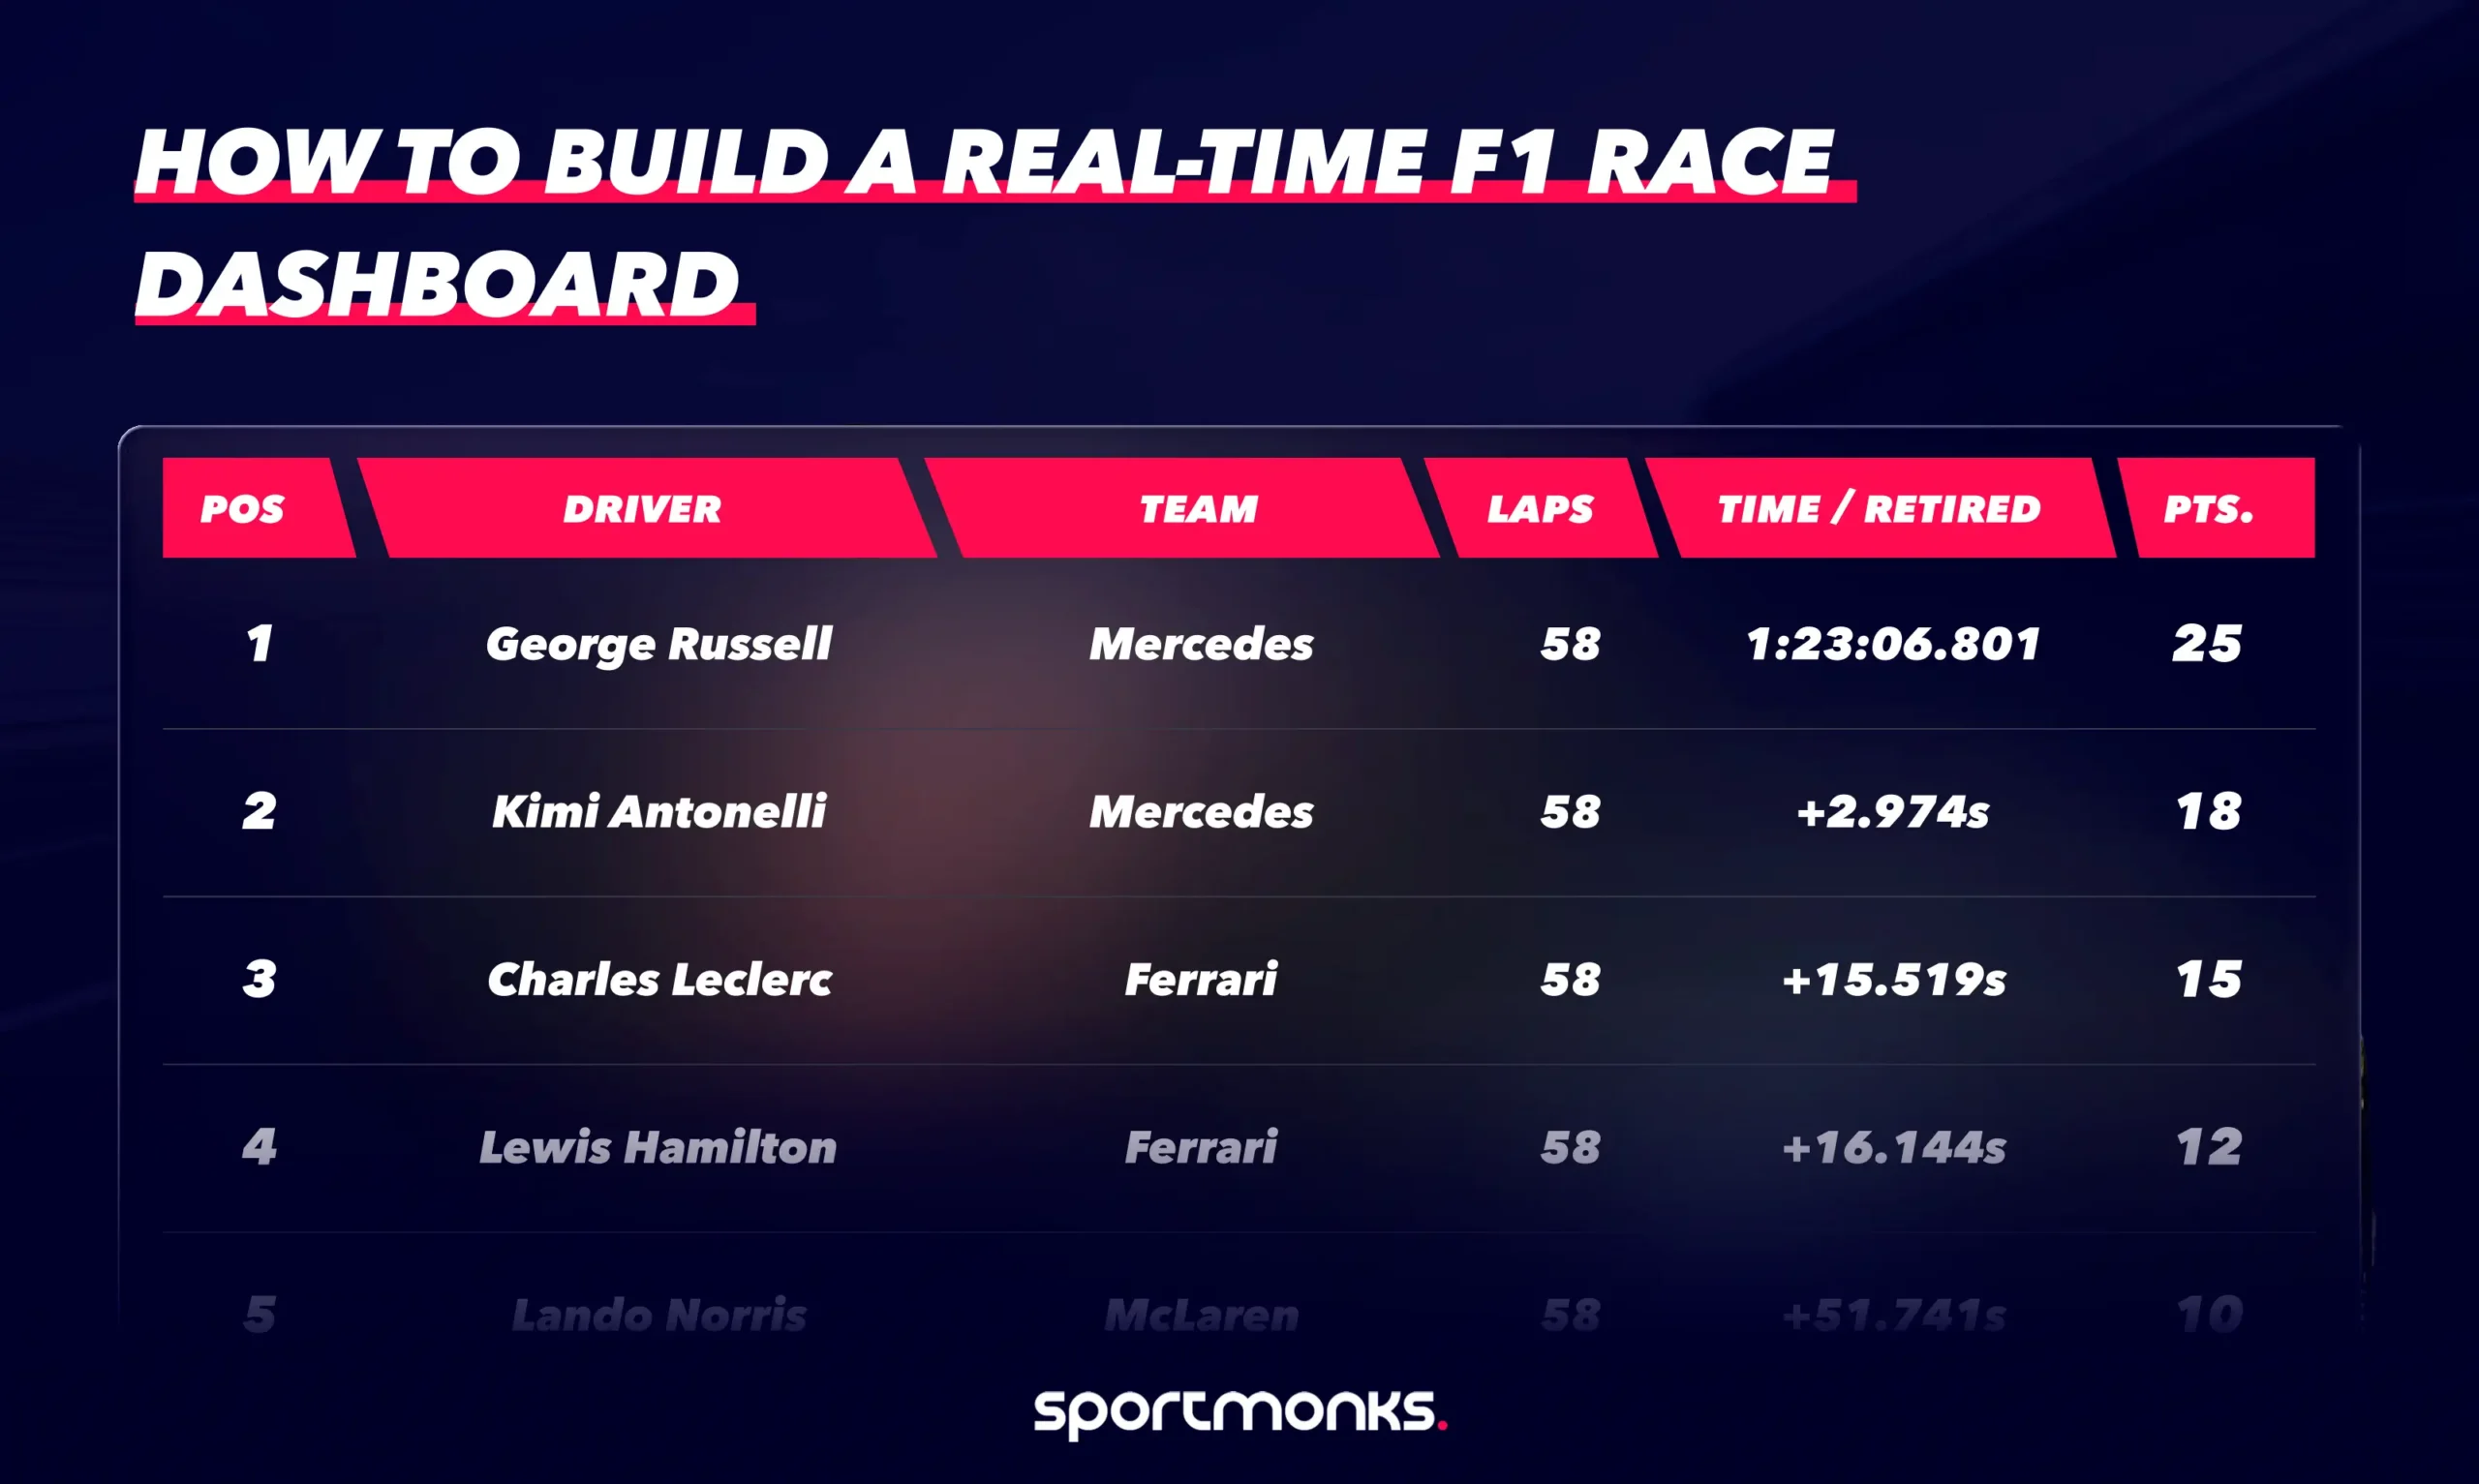
The most recognisable component of a race dashboard is the leaderboard.
This usually shows:
– driver positions
– gaps to the leader
– laps completed
– team information
In Motorsport API v3, results data contains structured race metrics such as driver position, fastest lap, tyre information, and interval data between competitors. This relational structure allows developers to easily combine race results with driver and team entities to build race leaderboards and performance dashboards.
Lap-by-lap timing
Lap timing is the foundation of race analytics.
The laps endpoints return lap-by-lap performance data, including lap duration and sector splits. These endpoints can be used to retrieve all laps or the most recent laps for a race fixture.
With lap timing data, you can build:
– lap charts
– pace comparisons
– stint analysis
– fastest lap tracking
This is often the dataset used to analyse differences in race pace between drivers.
Pit stop and strategy data
Strategy often determines the outcome of a Formula 1 race.
Pit stops temporarily shuffle the race order as drivers cycle through tyre strategies.
The pitstops endpoints allow developers to retrieve pit activity during a race, including the lap number and driver involved. Pit stop data can also include details such as pit duration, allowing developers to analyse stop performance and strategy decisions across the race.
When combined with lap timing, pit stop data helps explain why positions change during the race.
The architecture behind a race dashboard
Most dashboards follow a simple three-layer architecture:
Sportmonks Motorsport API
↓
Backend service (Node.js / Python)
↓
Frontend dashboard (React / Vue / web application)
The backend handles authentication and caching, while the frontend renders the user interface.
Separating these layers prevents exposing API tokens in client-side code and reduces unnecessary API requests during live sessions.
If you’re new to working with Sportmonks APIs, the Getting Started guide explains how authentication and your first requests work.
Step 1: Retrieve the race fixture
Every dashboard begins by identifying the race fixture.
const fetch = require("node-fetch");

const API_TOKEN = "YOUR_API_TOKEN";
const BASE_URL = "https://api.sportmonks.com/v3/motorsport";

async function getRaceFixtures() {
 const url = `${BASE_URL}/fixtures?api_token=${API_TOKEN}&include=venue,stage`;

 const res = await fetch(url);
 const { data } = await res.json();

 return data;
}
The response includes the fixture ID, which serves as the reference for retrieving race-specific data, such as laps, results, and pit stops.
Step 2: Detect live races
Once you know the fixture ID, your application can check whether the race is live.
async function getLiveRaces() {
 const url = `${BASE_URL}/livescores?api_token=${API_TOKEN}&include=state,participants,venue`;

 const res = await fetch(url);
 const { data } = await res.json();

 return data;
}
This endpoint returns the races currently running, along with their session states, enabling dashboards to automatically activate live updates.
Step 3: Retrieve lap-by-lap race data
Lap timing provides the performance layer of the dashboard.
async function getRaceLaps(fixtureId) {
 const url = `${BASE_URL}/fixtures/${fixtureId}/laps?api_token=${API_TOKEN}&include=driver,team`;

 const res = await fetch(url);
 const { data } = await res.json();

 return data;
}
Each record contains lap numbers, sector times, and total lap duration, allowing visualisation of pace differences across the race.
Step 4: Track pit stops
Pit stops are key strategy events during a race.
async function getPitStops(fixtureId) {
 const url = `${BASE_URL}/fixtures/${fixtureId}/pitstops?api_token=${API_TOKEN}&include=driver,team`;

 const res = await fetch(url);
 const { data } = await res.json();

 return data;
}
This endpoint returns each pit stop event associated with the race fixture.
Building the dashboard interface
Once the data pipeline is working, the frontend becomes a presentation challenge.
Most race dashboards contain three core visual components.
Race leaderboard
Displays driver order, lap counts, and time gaps.
Lap chart
Shows position changes across each lap of the race.
Strategy tracker
Highlights pit stops and tyre stints across the race.
Together, these views provide a clear narrative of how the race unfolds.
Ideas for expanding the dashboard
Once the basics work, there are several directions you can take the project.
Lap pace analysis — compare average lap times between drivers or teams.
Tyre degradation modelling — track how lap times change across each tyre stint.
Strategy prediction — estimate pit stop windows based on historical lap pace.
Championship tracking — combine race results with season standings to show how each race affects the championship.
Because the Motorsport API uses relational data structures across fixtures, teams, drivers, and results, many of these features can be built simply by combining existing endpoints.
Final thoughts
Formula 1 is one of the most data-rich sports in the world.
Every lap produces signals that shape the race’s outcome: pace changes, tyre strategy, pit-stop timing, and driver consistency.
A real-time race dashboard turns that raw data into something visible.
Instead of simply watching the race order change, users can see why it changes — which drivers are gaining pace, where teams commit to strategy calls, and how the race evolves lap by lap.
With the Sportmonks Motorsport API, that data is already available.
All that’s left is deciding how you want to visualise it.